A DoorDash Sales Analysis
Evaluating Marketing Effectiveness and Insights
Role: Data Analyst (Marketing & Growth)
Objective: Evaluate campaign effectiveness and customer segmentation to inform future marketing investment
Constraints: Limited data availability, Excel-only tooling
Outcome: Actionable recommendations with known confidence limits
Dataset: 2,025 customers (2014–2016), originally from iFood (DoorDash-like delivery platform). Available on GitHub and Kaggle.
Read the blog post here for a narrative overview of the case study.

Business Problem
The goal is to find business opportunities and insights and improve campaign strategy.
The marketing team wants to improve its campaigns by:
Targeting the right audience
Promoting the right products
Executing effectively across channels
Data Overview & Constraints
Included
Customer demographics (income, dependents, education, marital status)
Spend per product category
Campaign participation
Channel usage (store, web, catalog)
Complaint count
Order recency
Not Included (Key Constraints)
Campaign costs (CAC)
Subscription retention, churn, or lifetime value
Returns, refunds, and detailed complaint reasons
Product SKUs, margins, or supplier data
Geospatial or time-series ordering behavior
Customer experience and operational signals
Implication:
Recommendations emphasize what can be responsibly acted on given these constraints.
Analytical Approach
Segmented customers by campaign participation and retargeting status
Normalized spend behavior by income bands
Compared campaign reach vs value (avg spend per customer)
Analyzed product category preferences by campaign
Evaluated channel mix differences between members and non-members
Flagged overlap and retargeting effects that complicate attribution
Key Findings
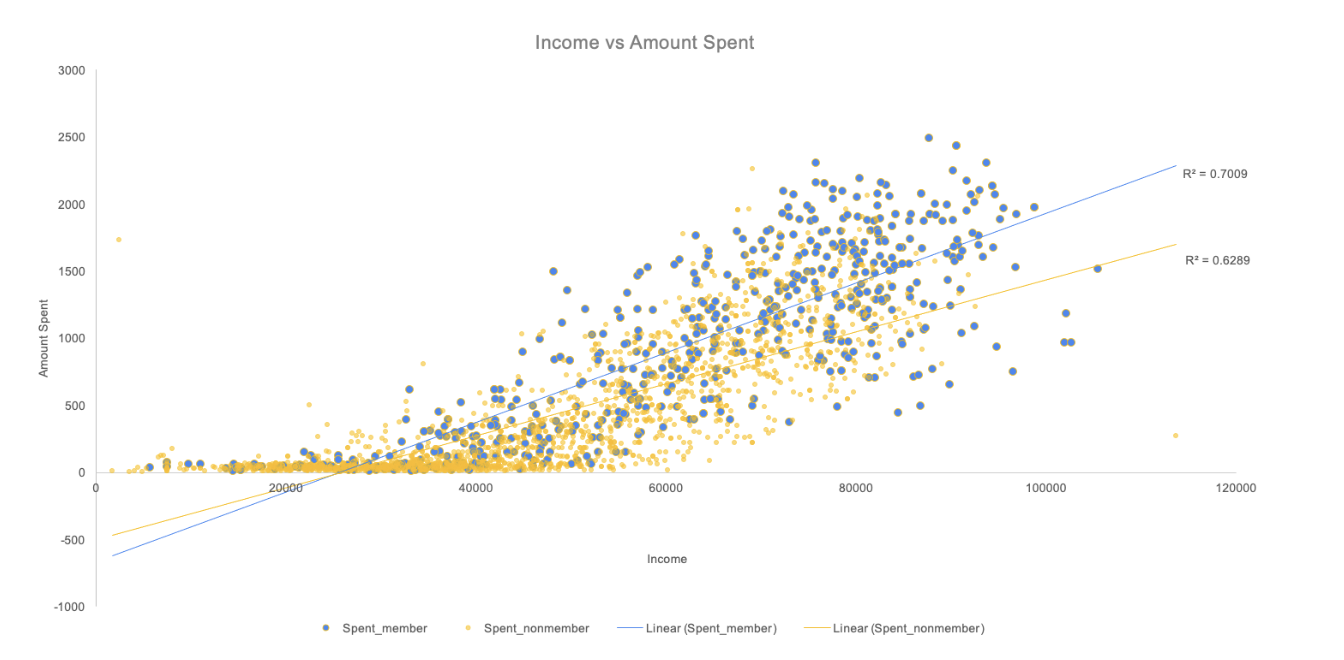
1. Campaign Membership Correlates With Higher Spend — But With Diminishing Returns
Campaign members spend more than non-members at comparable income levels
Income explains a significant portion of spend variance
R² ≈ 70% (campaign members)
R² ≈ 62% (non-members)
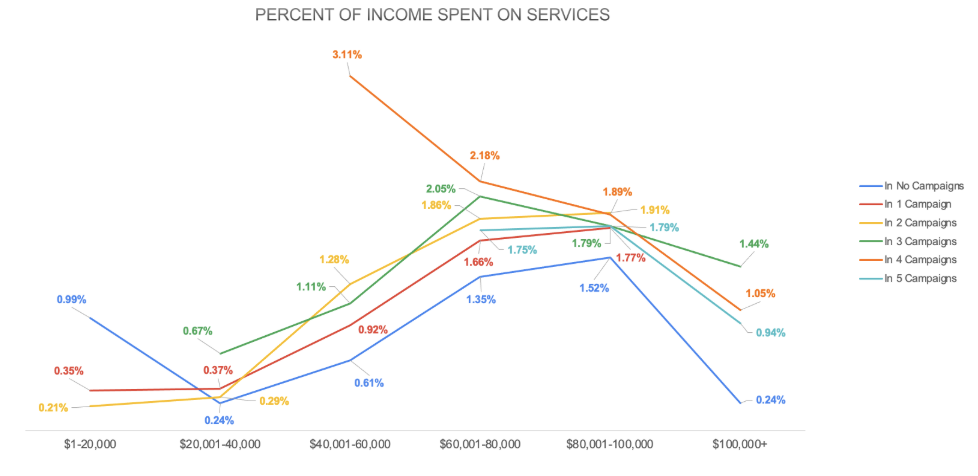
Customers in multiple campaigns eventually spend a lower percentage of income, suggesting saturation rather than loyalty at higher exposure levels
Implication: Campaigns increase spend, but indiscriminate scaling risks diminishing marginal returns.
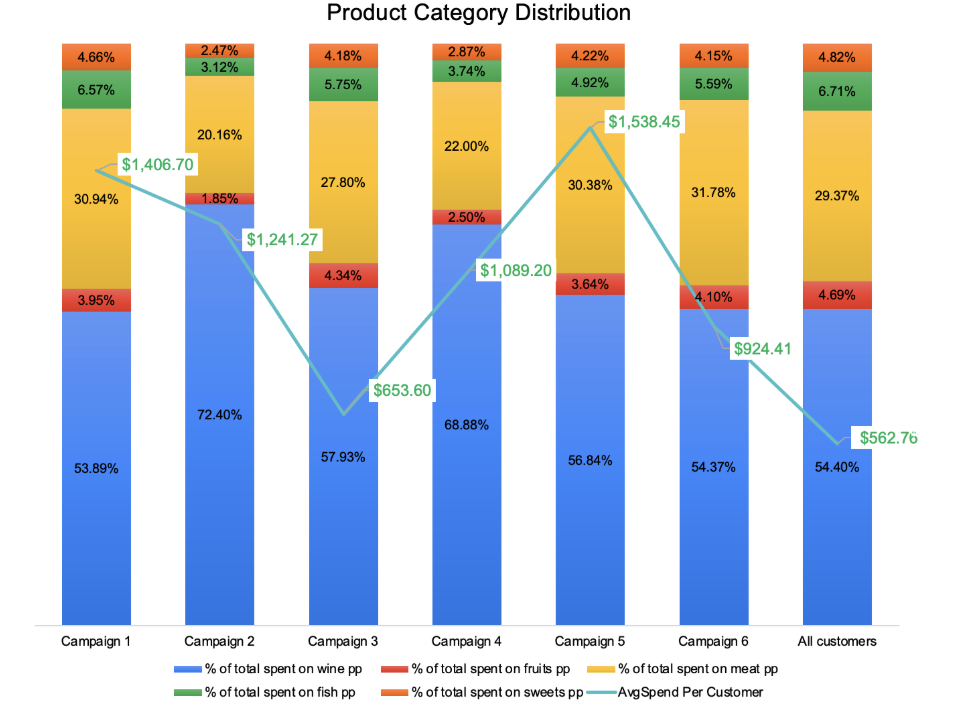
2. Product Preference Is Strongly Skewed Toward Wine
Wine is the dominant category across all campaigns
Meat is consistently the secondary category
Other categories (fish, sweets, fruit) remain relatively stable and minor
Implication: Product-led campaign strategies should center on wine, with selective bundling rather than broad category expansion.
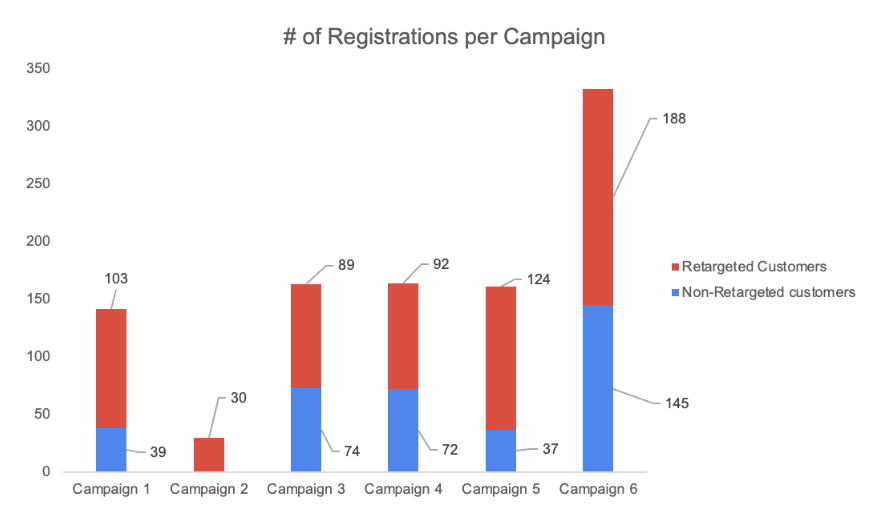
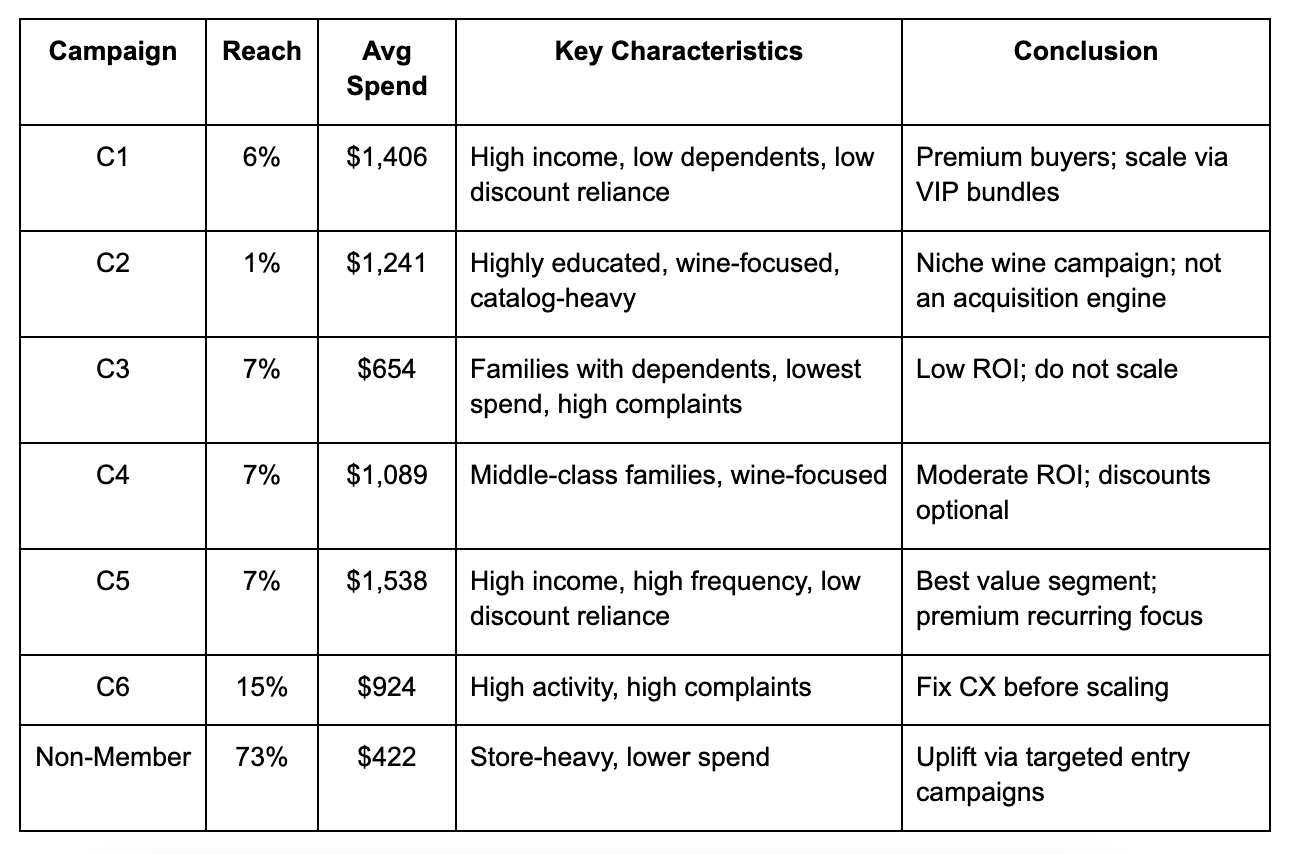
3. Campaign Effectiveness Varies Sharply by Reach vs Value
Campaign 6 has the highest registrations but elevated complaint indicators
Campaigns 1 and 5 generate the highest average spend per customer with low discount reliance
Campaign 2 shows no new customer acquisition and relies entirely on retargeting
Implication: Reach alone is a misleading success metric without value and friction context.
4. Channel Preferences Differ Between Campaign Members and Non-Members
Campaign members purchase more via catalog
Non-members purchase more in-store
Higher catalog usage correlates with higher complaint rates in certain campaigns
Implication:
Channel mix influences both value and operational risk.

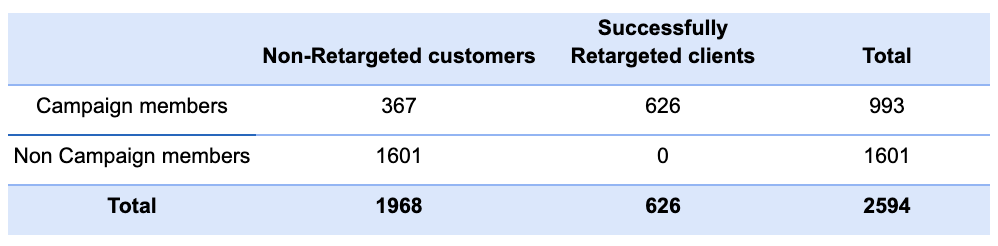
5. Customer retargeting causes overlap between campaigns that complicate attribution spend behavior and causality.
There are a total of 993 registrations, the majority of whom were retargeted and joined multiple campaigns
Campaign 2 is entirely sourced and retargeted from other campaigns
Impossible to delineate product market fit without product distribution per order in addition to per campaign
Implication:
Analysis is limited to categorizing non campaign members from campaign members and retargeted customers.
Campaign Synthesis
Testable Hypotheses
Customers with low discount reliance generate higher average spend
Wine-focused campaigns outperform mixed-category campaigns in value
Higher catalog usage is associated with increased complaint rates
Retargeting overlap inflates perceived campaign effectiveness
High-reach campaigns without CX alignment increase friction risk
These hypotheses require validation using CAC, retention, and complaint-level data.
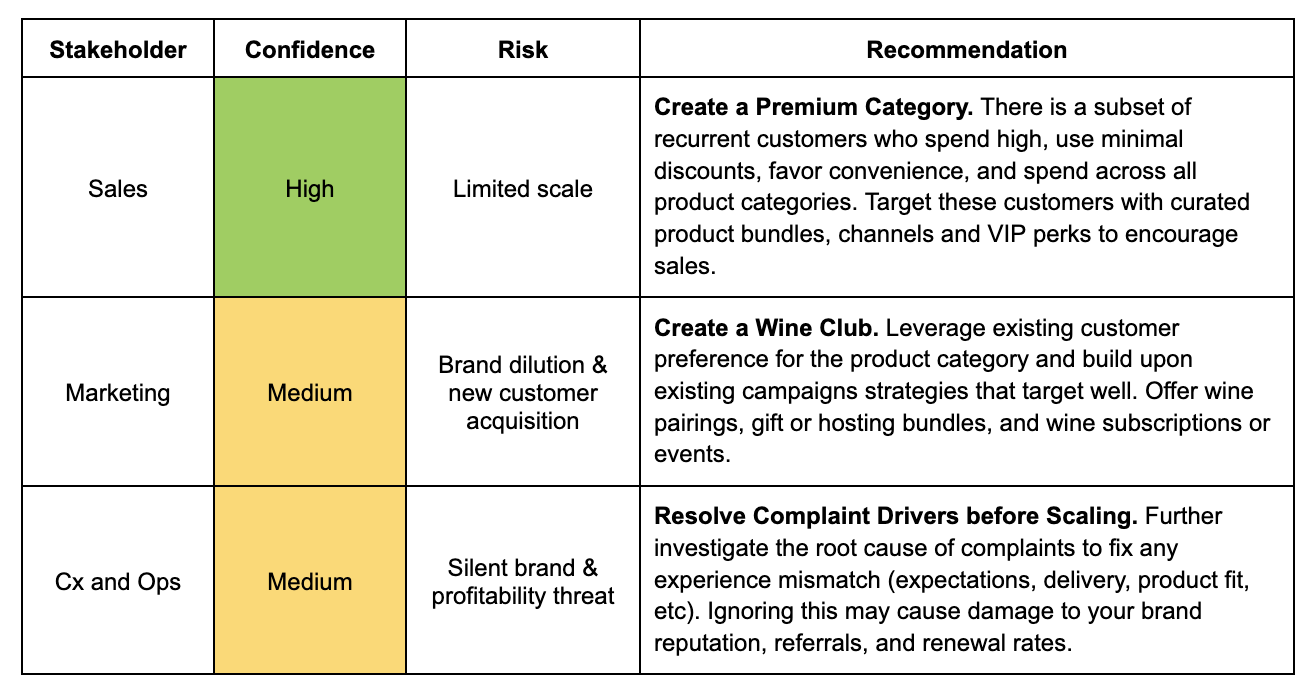
Recommendations by Stakeholder
Sales / Revenue
Prioritize C1 and C5 for premium offerings
Focus upsell and cross-sell around wine-based bundles
Avoid scaling low-value, high-friction campaigns
Marketing
Evaluate campaigns using reach + value, not registrations alone
Use catalogs for curated, high-value segments
Use stores/web for broader acquisition
CX / Operations
Investigate complaint drivers in C3 and C6 before further investment
Align customer expectations with channel and campaign messaging
Add operational KPIs before scaling acquisition spend
Risks & What’s Missing
No marketing cost data limits ROI conclusions
No purchase order detail limits correlations on buying patterns to campaigns
No retention or churn data limits lifetime customer value assessment
Complaint counts lack root-cause classification
No operational data limits profitability conclusions
Next Data Needed:
CAC, retention rates, purchase order detail, complaint taxonomy, and margin by product SKU.
Decision Confidence Summary
This case demonstrates my ability to frame ambiguous business questions, analyze under real-world constraints, and deliver decision-safe recommendations.