A DoorDash Sales Analysis & What it teaches us about Successfully Framing "Success"
Executive Summary
Role: Data Analyst (Marketing & Growth)
Objective: Evaluate campaign effectiveness and customer segmentation
Constraints: Limited data availability, Excel-only tooling
Outcome: Actionable recommendations with known confidence limits
Dataset: 2,025 customers (2014–2016), originally from iFood (DoorDash-like delivery platform). Available on GitHub and Kaggle.
Why this project
All businesses have access to data these days. In fact, most are swimming with information that they don’t know what to do with. People feel called to aggregate, analyze, automate, and apply data to their decision framework so that they can keep up with the times. Maybe even test out some AI tool or agent that generates a 2,000 word article summarizing everything that they already know.
Sigh 🤦♀️ Another one bites the dust.
Before jumping on the bandwagon of “data is the new oil” and calling for a generic analysis of your databases, I beg you to pause and question deeper …
WHY, HOW, and for WHAT purpose ?
Here’s why you should keep reading
Investing in a data-backed approach does not guarantee to give you the desired results. However, learning how to ask the right questions for the right reason, does.
The purpose of this project is to show a real life, relatable example of how data is transformed into value.
To start, I will share my findings at first glance. What a beginner analyst would report as significant, and the resulting action that a business would take. Secondly, I will share how a seasoned analyst would structure their report, framing hypotheses and findings to provide value for their client.
You will begin to understand how appropriately framing data problems and success metrics can influence businesses, answering questions like:
Where should I invest, based on how I am different from the competition ?
Are there unknown truths that my data reveals about my customers ?
What actually limits success ?
This is a training exercise in perspective, and an opportunity to assess if your own data is being deployed to its full potential.
The What & Where of the Dataset
I received this dataset as part of the Avery Smith's Data Career Jumpstart Bootcamp. Originally, this data comes from iFood, a Brazilian food-delivery company that operates like DoorDash.
Included
Customer demographics (income, dependents, education, marital status)
Spend per product category
Campaign participation
Channel usage (store, web, catalog)
Complaint count
Order recency
Not Included (Key Constraints)
Campaign costs (CAC)
Subscription retention, churn, or lifetime value
Returns, refunds, and detailed complaint reasons
Product SKUs, margins, or supplier data
Geospatial or time-series ordering behavior
Customer experience and operational signals
The Analysis
Acting as a data analyst for DoorDash, the challenge is to understand the data, find business opportunities and insights, and propose action to optimize results of future campaigns. The company wants to improve its marketing and evaluate how they should further penetrate the market. In summary, we are assessing:
Are they targeting the right audience,
With the right product,
The most effectively
?
Findings at first glance
Experience with the project scope leads to a better report, as each measurement variable has a breadth of nuance that only subject matter experts truly understand. This dataset holds a story that needs to be directed appropriately; otherwise, it will lead you down a rabbit hole that only upturns one version of events.
In this example, without further detail from the client about how to define success, the most reasonable signal would be an uplift in sales for the sales and marketing team.
Here is what first stands out as significant.
Regarding who to target as the right audience
Customers who register in campaigns have an increased spend in services. Additionally, the total amount spent increases as a customer’s income increases.
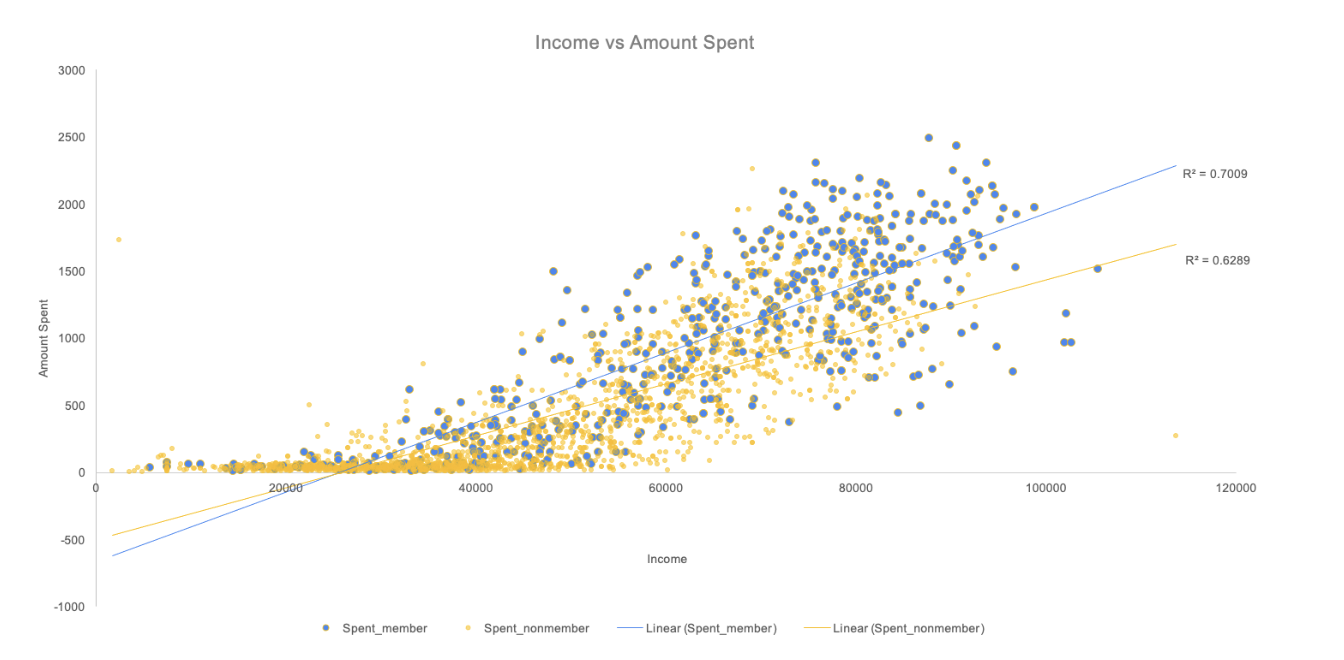
We can "predict" how much a customer will spend with R square values. To interpret the chart, 62% (non-campaign members) and 70% (campaign members) of the variance of the "Total Spent" is determined by a change in income. Since the member trendline is above the non-member line, campaign membership proves to be successful in influencing higher spend amounts with customers.
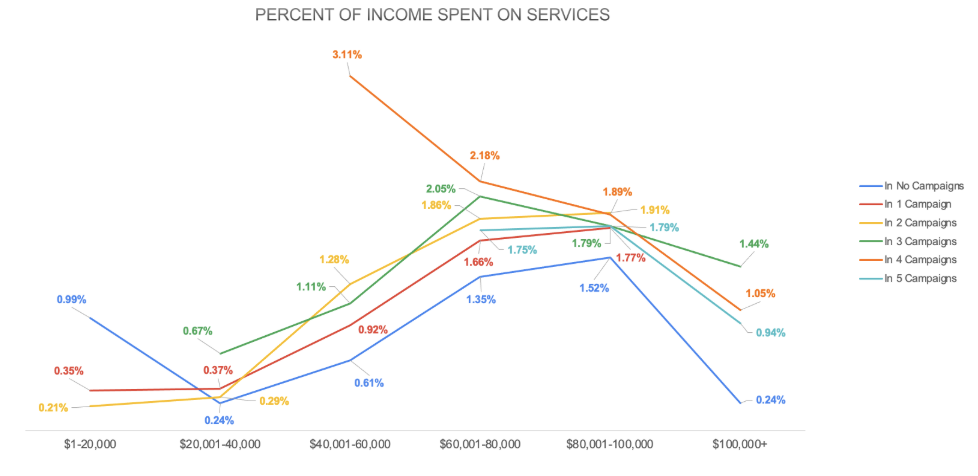
This claim is further strengthened in the next chart, where customers with higher incomes spend a higher percent of their income on services. Moreso, we observe how customers at different income bands have different spending patterns. Despite higher income, customers in 4+ campaigns reduce percentage of income spent, suggesting saturation rather than loyalty.
Lastly, upon investigating customer demographics, we observe that campaign members who made the highest incomes had the least number of dependents and were the most liberal in spending without a discount.
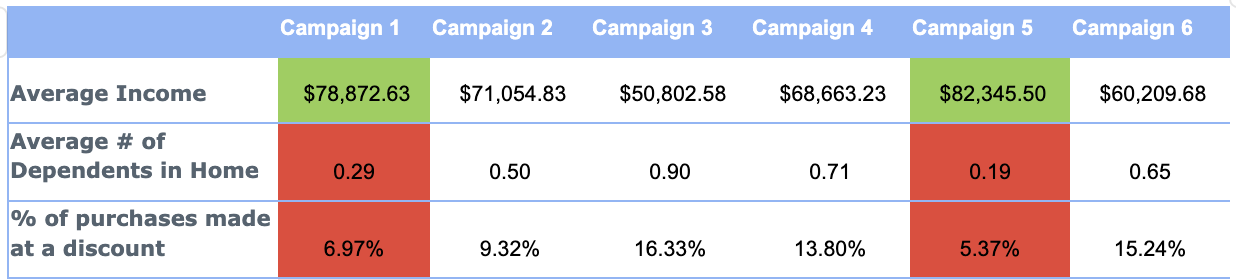
This threadline would recommend that the “best” target customer has an income between $40,000-$100,000, is active in 2-4 campaigns, and has significantly less dependents than average.
Regarding what are the right products to promote
2. Wine is the preferred product over all other categories. Meat shows as a secondary highly purchased product category.
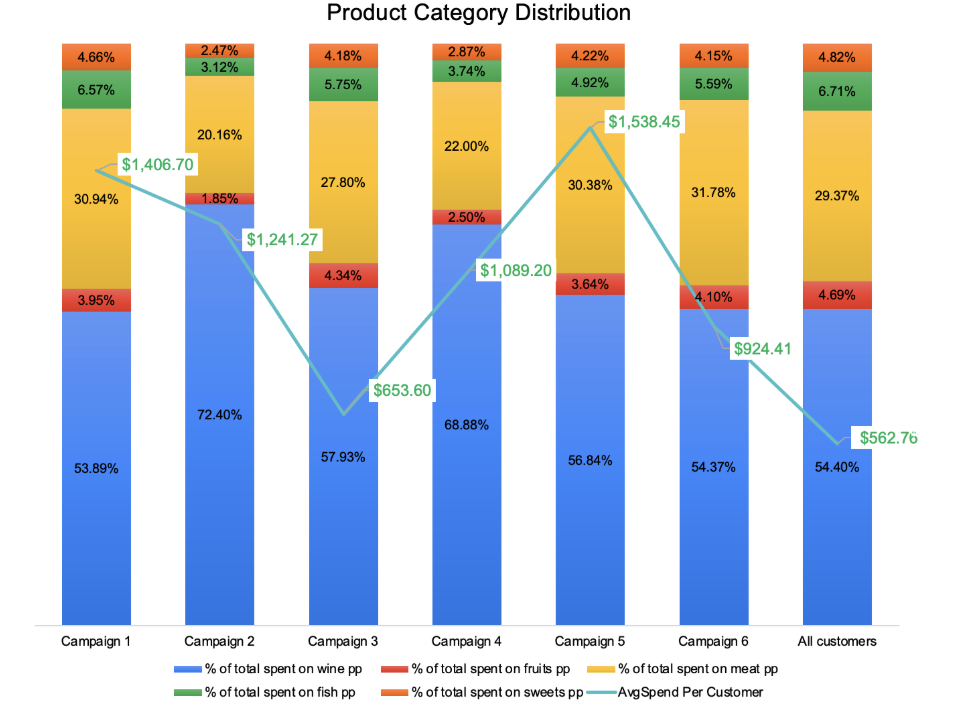
Additionally, there are indicators that some campaigns outperform others based on amounts spent on services. Marketing should consider if there were certain products, messaging, or tactics applied in these campaigns that contributed to the uplift. The data provided only segments product distribution per campaign instead of per order, so it is impossible to further delineate product market fit without additional context.
Regarding which campaigns are the most effective
3. Campaigns successfully engage and strengthen brand loyalty by retargeting customers. Marketing strategies could be more tactful in aligning sales channels with campaign and non-members, as they have different utilization rates. And there are further opportunities to promote campaigns during slow onboarding seasons.
An early success signal is that campaign 6 is the most successful in customer registration. There are a total of 993 registrations, the majority of whom were retargeted and joined multiple campaigns.
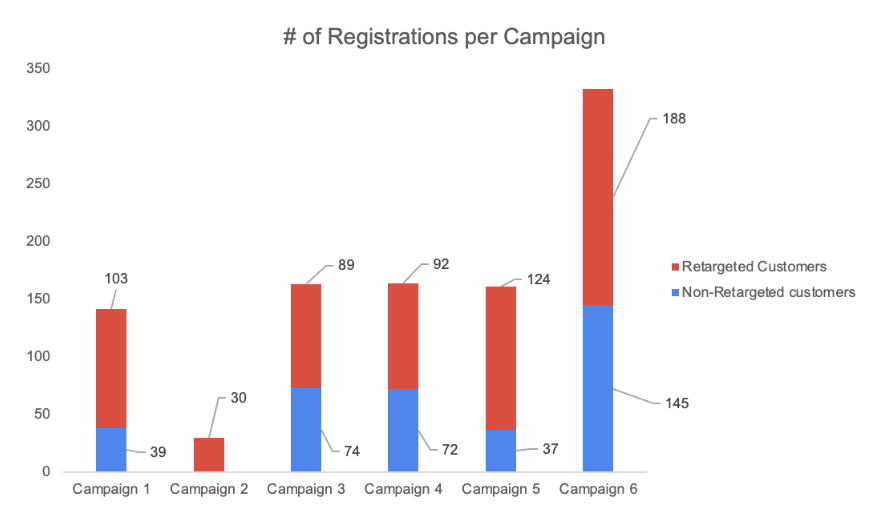
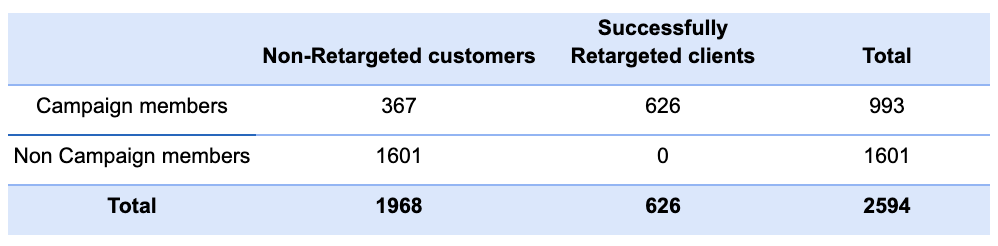
Also noteworthy is that campaign 2 is entirely sourced and retargeted from other campaigns, meaning it was not effective (or was not executed with the purpose of) at acquiring new customers.
Without more detail in the data, customer retargeting creates overlap between campaigns and introduces a level of uncertainty that complicates correlations of spending behavior and causality. Therefore, analysis is limited to categorizing non campaign members from campaign members and retargeted customers.
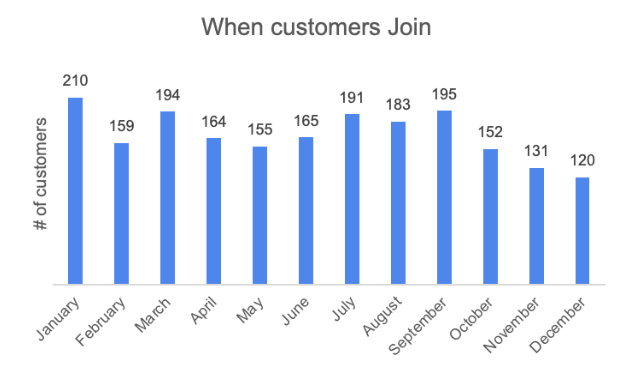
Some final insights are that customers did not usually begin using services in Q4, and that campaign members tend to purchase more often from catalogs and less from the store compared to non campaign members.

Recommendations at First Glance
If our only goal is to increase sales, these findings would lead campaign managers to focus on:
The highest earning and low dependent households (preferably retargeted customers)
With wine and meat products,
Through a catalog during slow, winter months.
While these are all valuable insights, aggregating the recommendations generalizes success. There is not enough cohesion in the data thread to be able to make these decisions indisputably.
If I filter the database with this version of success, my subset of “ideal” customer profiles with aligned buying behavior makes up only
10% of all customers and 20% of all revenue
And the rest of the addressable market is left on the table for competitive campaign managers with a better strategy.
We need to transition from “We have data” to “We know what we can responsibly act on.”
So, what can we do about it? How do we tell a better story from the analysis? What framework can be used to reveal deeper truths from our data instead of limiting ourselves to dispersed and incremental changes?
Findings from a framed approach
Think like your client
Although improving marketing campaigns is the main objective, there are other factors that will be influenced by this report. I created a hierarchy of stakeholders, their definition of success, and specific questions that would advise them on strategic decisions.
Sales / Revenue - Success is an increase in total sales, and being able to identify which channels scale a positive and consistent rate of growth.
Where to allocate sales efforts?
What campaign elements produce the best spend per customer?
Which customer segment responds to upsell/cross-sell?
2. Marketing - Success is engaging customers with a tailored offer that results in converting customers to sales.
Which campaign is “working” (reach vs value)?
What channel to emphasize (catalog/web/store)?
Who should we target next (based on profile)?
3.CX / Ops - Success is retaining spending customers with the least amount of complaints, returns, or unsubscriptions at the highest level of profit margin.
Where are complaints clustering?
Is channel mix correlated with complaints / recency?
What friction point to fix first?
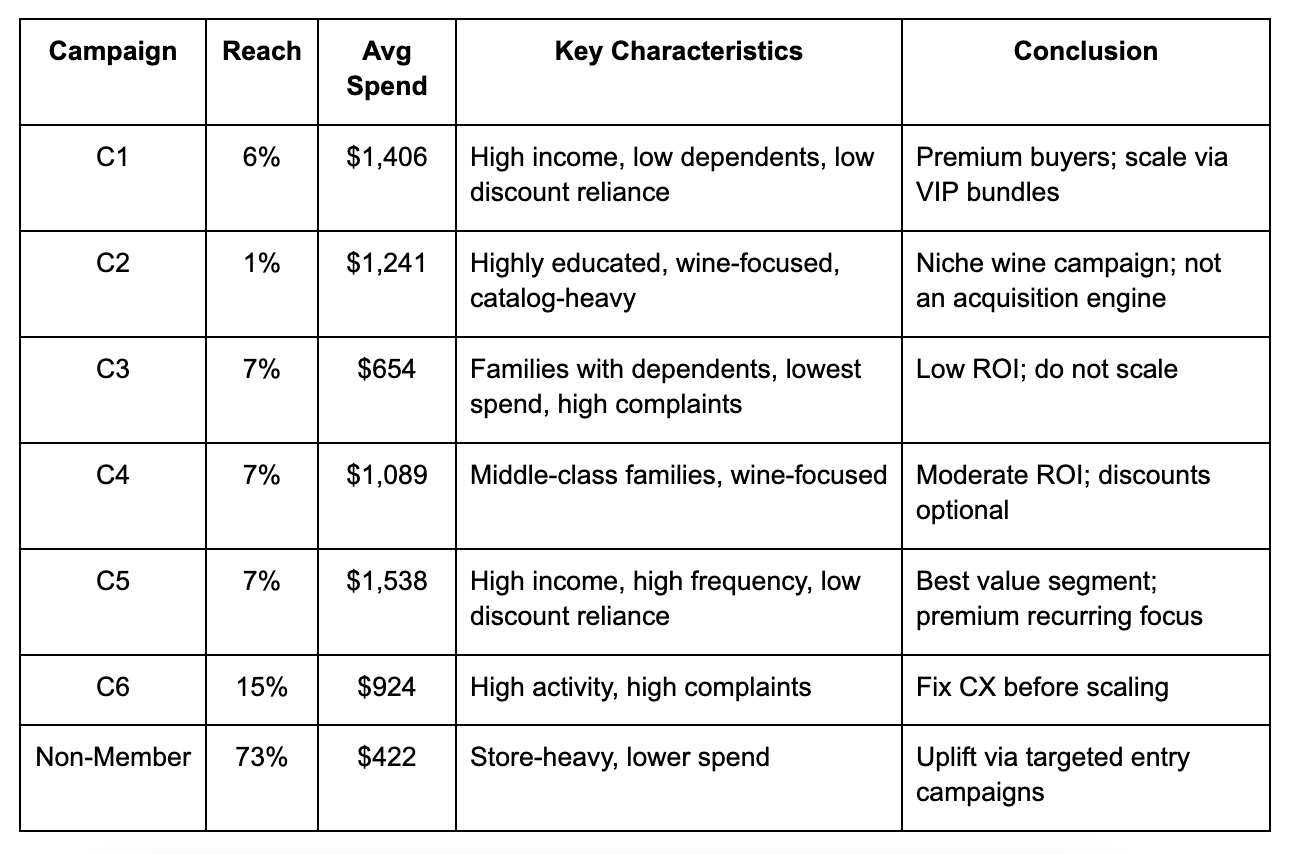
Synthesize campaigns into digestible metrics, interpretations, and conclusions
I derived a table as a single source of truth that allows for quick cross-comparisons when identifying data threads to explore further. Some initial questions from stakeholders can already be answered here.
Create data-backed hypotheses that can be tested for accuracy or relevance against future decisions
Creating a short list of hypotheses from the perspective of your stakeholders and initial findings will truth test your beliefs. This is the starting data thread that turns complexity into real-world clarity.
For the sake of this project, I’ve constrained hypotheses within the campaign-profile, the business impact, or as a casual sales lift claim, and I’ve recycled some insights from the first part of my analysis.
Customers with low discount reliance generate higher average spend
Wine-focused campaigns outperform mixed-category campaigns in value
Higher catalog usage is associated with increased complaint rates
Retargeting overlap inflates perceived campaign effectiveness
High-reach campaigns without CX alignment increase friction risk
Apply these findings to recommend the best path for each stakeholder
My stakeholders have mixed incentives, and there is no one sized-fit all answer to their questions. As new requests and data become available for analysis, I would revisit this framework and my resulting data story around those objectives and constraints.
For now, here are my findings.
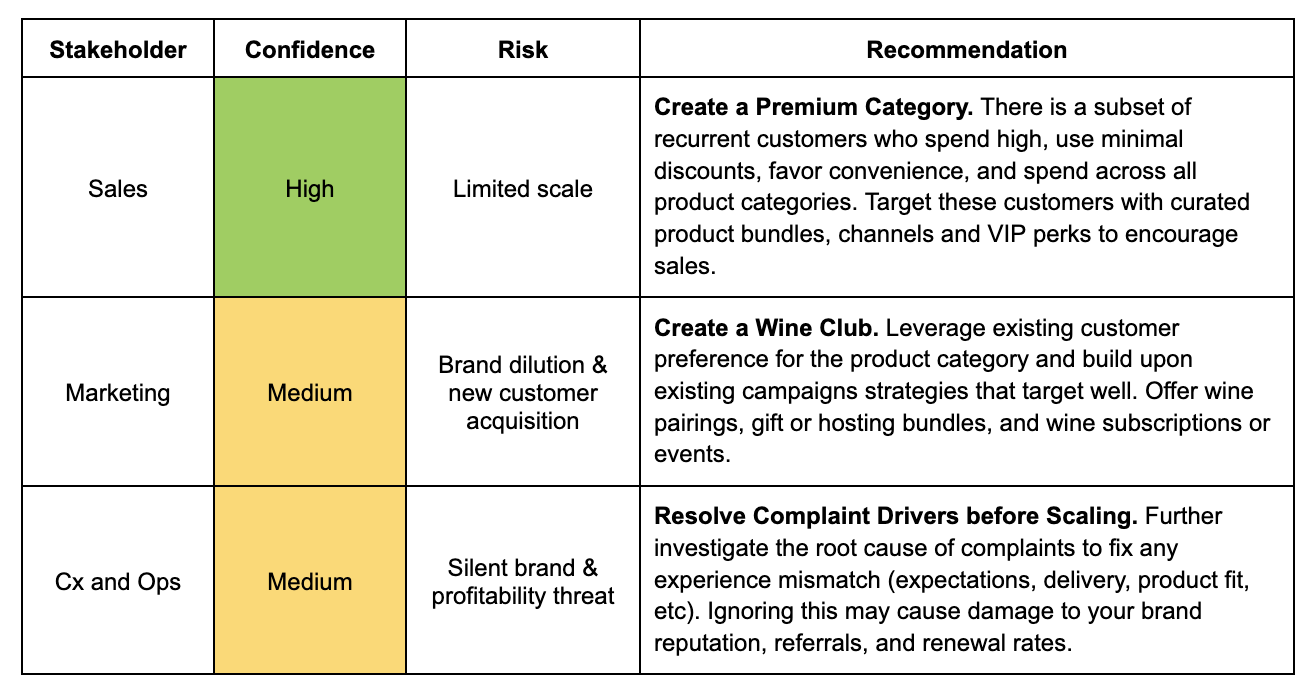
Sales / Revenue
Where to allocate sales effort? Prioritize C1 and C5 for premium offerings.
Which campaign elements produce the best spend per customer? Wine.
Which customer segment responds to upsell/cross-sell? Wine & catalog customers. Avoid scaling low-value, high-friction campaigns.
2. Marketing
Which campaign is “working” (reach vs value)? C5 + C6. Evaluate campaigns further using cost of customer acquisition (CAC) to determine reach and value, not determining success based on registrations alone.
What channel to emphasize (catalog/web/store)? Use catalogs for curated, high-value segments. Use stores/web for broader acquisition.
Who should we target next (based on profile)? High income, highly educated customers who value convenience over discount reliance.
3. CX / Ops
Where are complaints clustering? C3 + C6. Median income, family homes.
Is channel mix correlated with complaints / recency? Low store and high catalog purchases may suggest communication break between customer expectations with channel or campaign messaging.
What friction point to fix first? Add operational KPIs before scaling acquisition spend. Investigate complaint drivers with additional data.
What We’d Need Next
There are certain things this report can not prove because of missing detail in the data and project scope. My recommendations contain risks that with the appropriate context would otherwise elevate the report findings and results.
Marketing cost data (CAC) for ROI conclusions when assessing customer value vs campaign reach
Purchase order detail to correlate buying patterns linked to specific campaign strategies without retargeting overlap
Subscription retention or churn data to assess lifetime customer value
Complaint counts root-cause classification
Operational data for profitability conclusions when judging long term business growth against risk aversion strategies
Final Recommendations
As I go back to the DoorDash team and summarize,
Are they targeting the right audience,
With the right product,
The most effectively
?
I’d say, I need more context on your campaigns and goals. Campaigns have proven to be effective in increasing spend, but only when aligned with customer profile and channel behavior.
From the data provided, these are the sharpest next steps to act on your sales and marketing opportunities:
Call to Action
So, are you the person working with a half baked strategy, or are you eating what’s left of your competitor’s underserved market?
If this article gives you a fresh perspective, feel free to reach out to me directly. We can assess how to apply your data to its full potential. 🤓